
JaxRE: Real Estate Analytics Platform
Comprehensive real estate data analysis platform with interactive maps, comparables search, and property valuation tools for Duval County, Florida.

Building innovative web applications, data analytics platforms, and interactive experiences. Specializing in real estate analytics, machine learning, and modern web technologies.

Comprehensive real estate data analysis platform with interactive maps, comparables search, and property valuation tools for Duval County, Florida.

Custom responsive, SEO optimized website for a professional electrician.
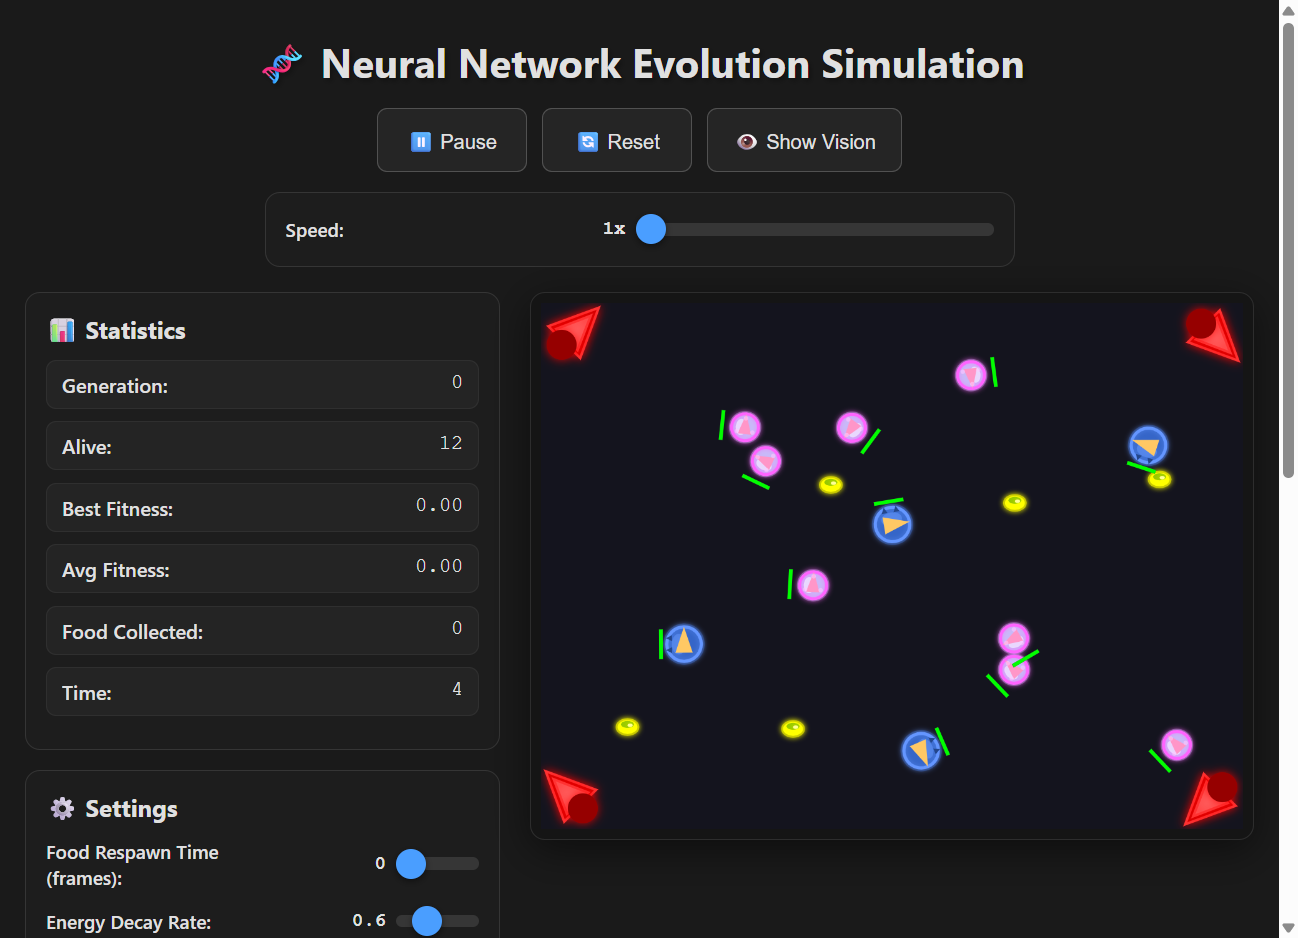
Watch creatures evolve neural networks through generations as they learn to navigate, find food, and avoid obstacles in a simulated ecosystem.

Finds the best fitting curve from points on an interactive graph.

Automatic labeling of color based on RGB values

Detects objects from a video stream.

Build a prediction model from scratch in the browser with TensorFlow.js

Visualize the edit distance between words.

Predicts whether a comment is positive or negative.

Predicts context/synonyms from a list of words.
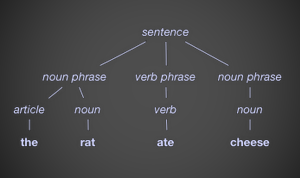
Extracts sentences, parts of speech, and stats from a body of text.
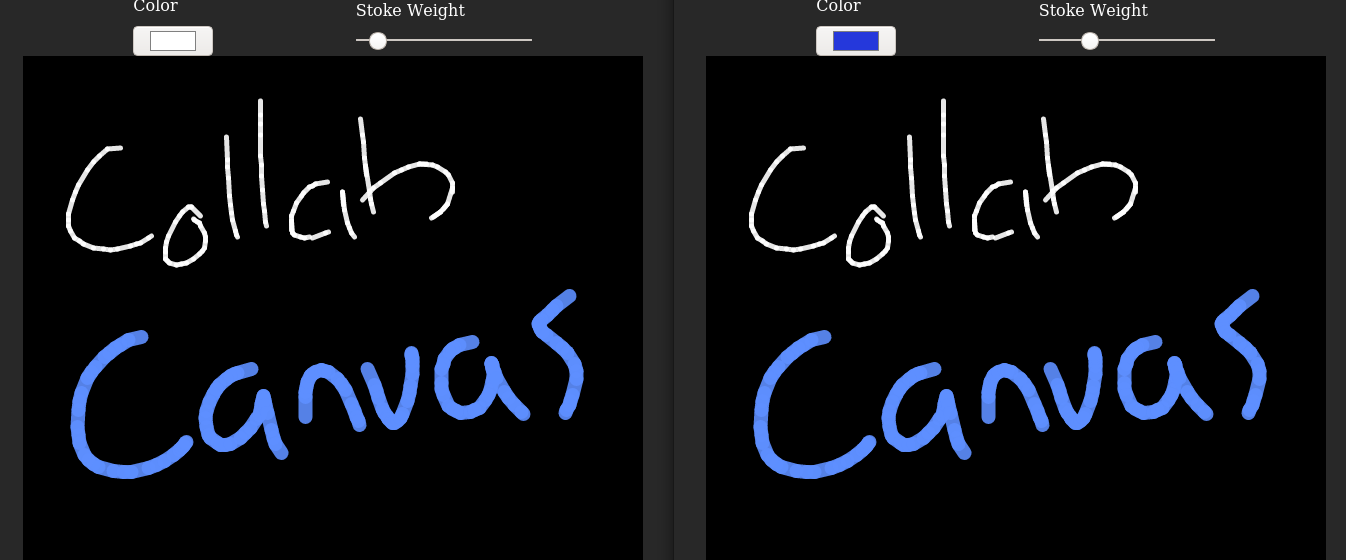
Draw in real time with multiple users.

Paint pixels with sound.

Unlock your inner meme lord.

Generate random (solvable) mazes with configurable complexity.

Unified workspace for data processing, visualization, and analysis. Merge, join, transform CSV/JSON files, generate charts, and build workflows—all in one place.

Manage time spent on tasks. Export timesheets.

Estimates impressions, clicks, and cost from budget and lead volume goals.

Given a zipcode, provides nearby cities, zip codes, counties, and states.

Generate PPC keyword lists from templates.